

The revenue side of energy assets stopped being simple.

Volatility is the revenue model
Price spreads, negative prices and balancing premiums. Capturing the opportunities in volatile markets takes daily decisions, not annual reviews.

The revenue stack multiplied
Day-Ahead, intraday, aFRR, mFRR, voltage regulation, capacity mechanisms, guarantees of origin: each market with its own rules, calendars and requirements.

Power markets are constantly changing
As the energy transition continues, even established markets can shift dramatically year to year. Close monitoring and fast course correction are essential.
Four deliverables, on a fixed calendar.
Not open-ended consulting: a recurring mandate with named deliverables your board can hold us to.

A defensible revenue baseline
Your asset simulated in One Hub Analytics: conservative, medium and optimistic scenarios, degradation-aware operations and sensitivity analyses, ready for committees and lenders.

Route-to-market contracts
PPA, floor or tolling structures negotiated and benchmarked against the market. We follow the market closely to spot the right moment.

Market representation, optimised
Benchmark the performance of different agents, levelise commercial structures and fees, and select the right party to operate your asset. Capture the uplift that was promised.
A revenue report your investors can read
From monthly to close to real-time reporting. Performance against the baseline and against market benchmarks, so operating policies can be steered in time.
One operating loop. Four stages.
Each stage feeds the next. The same accountable team runs the entire loop.

Revenue baseline
Every engagement starts with a defensible picture of what the asset can earn: 8,760 hours of annual operation, sequential multi-market dispatch, real battery degradation.
- Conservative / medium / optimistic scenario envelopes
- Day-Ahead, intraday, ancillary & capacity stacking
- Lifetime modelling up to 40-year horizons
Revenue stacking & route-to-market
With the simulation as baseline, we define how the asset goes to market: which products, which contracts, which counterparties.
- PPA, floor and tolling contract advisory
- Market agent benchmark and renegotiation
- Market registration and access (OMIE, REE, MARI, TERRE)
Capacity market participation
Capacity revenues optimised inside the same stack, not in isolation: participation strategy for the UK mechanism and entry strategy for Spain's upcoming auctions.
- Spain auction readiness and entry strategy
- UK T-1 / T-4 strategy, prequalification, derating
- Agreement management, recurring annual support
Revenue reporting
The loop closes with recurring reporting against the baseline and against the market: what the asset earned, why, and what to adjust next period.
- Performance vs. baseline and vs. market benchmarks
- Investor and lender-ready reporting
- Every cycle sharpens the next forecast
Three levels. One relationship.
Every asset is different, but the structure is the same. Pick the level that fits your stage — and scale when you're ready.
Revenue Intelligence
The data foundation. Simulation, forecasting and reporting, delivered as a recurring subscription.
- Annual revenue simulation across conservative, medium and optimistic scenarios
- Quarterly market and pricing update
- Investor-ready revenue report per period
- Access to One Hub Analytics platform
For assets in financing or early operations that need a defensible revenue case and ongoing visibility.
Active Strategy
Intelligence plus route-to-market advisory. We define and manage the strategy; you keep operational control.
- Everything in Level 1
- Revenue stacking and route-to-market design
- Capacity market participation (Spain & UK)
- Market agent benchmark and renegotiation
- Quarterly strategy review and adjustment
For owners who want expert advisory on how the asset goes to market, without outsourcing execution.
Full Revenue Management
End-to-end: baseline, strategy, market representation and continuous performance management, run by our team alongside your operations.
- Everything in Level 2
- Aggregator and market agent benchmarking, selection and renegotiation
- Continuous performance management against baseline and market
- Technical optimisation measures identified with the asset management team
- Short-term market forecasts to support daily decisions
For assets in full operation where the owner wants maximum yield with minimum operational burden.
All levels are priced per asset, per year. Multi-asset portfolios benefit from volume pricing.
Revenue is one half of the picture. The technical side — performance, availability and O&M — is covered under Active Asset Management, and the two are usually run together.
Built to be trusted with your revenue line.

Senior-led, always
The people who model your asset are the ones who sit in the review with you, mandate after mandate. No hand-offs.
Our own technology
Simulation and forecasting run on platforms we build and test daily: the engine behind 3 GWh under subscription.

Built for lender review
Every deliverable is built for data-room scrutiny: transparent assumptions and defensible numbers.

Annual recurring model
Aligned with the market and regulatory calendar, with defined deliverables per period.
Engagements like yours.
 No project photo
BESS origination strategy for a 300 MW pipeline in Spain
No project photoStorage strategy for 25 MW and 100 MW BESS reference plants
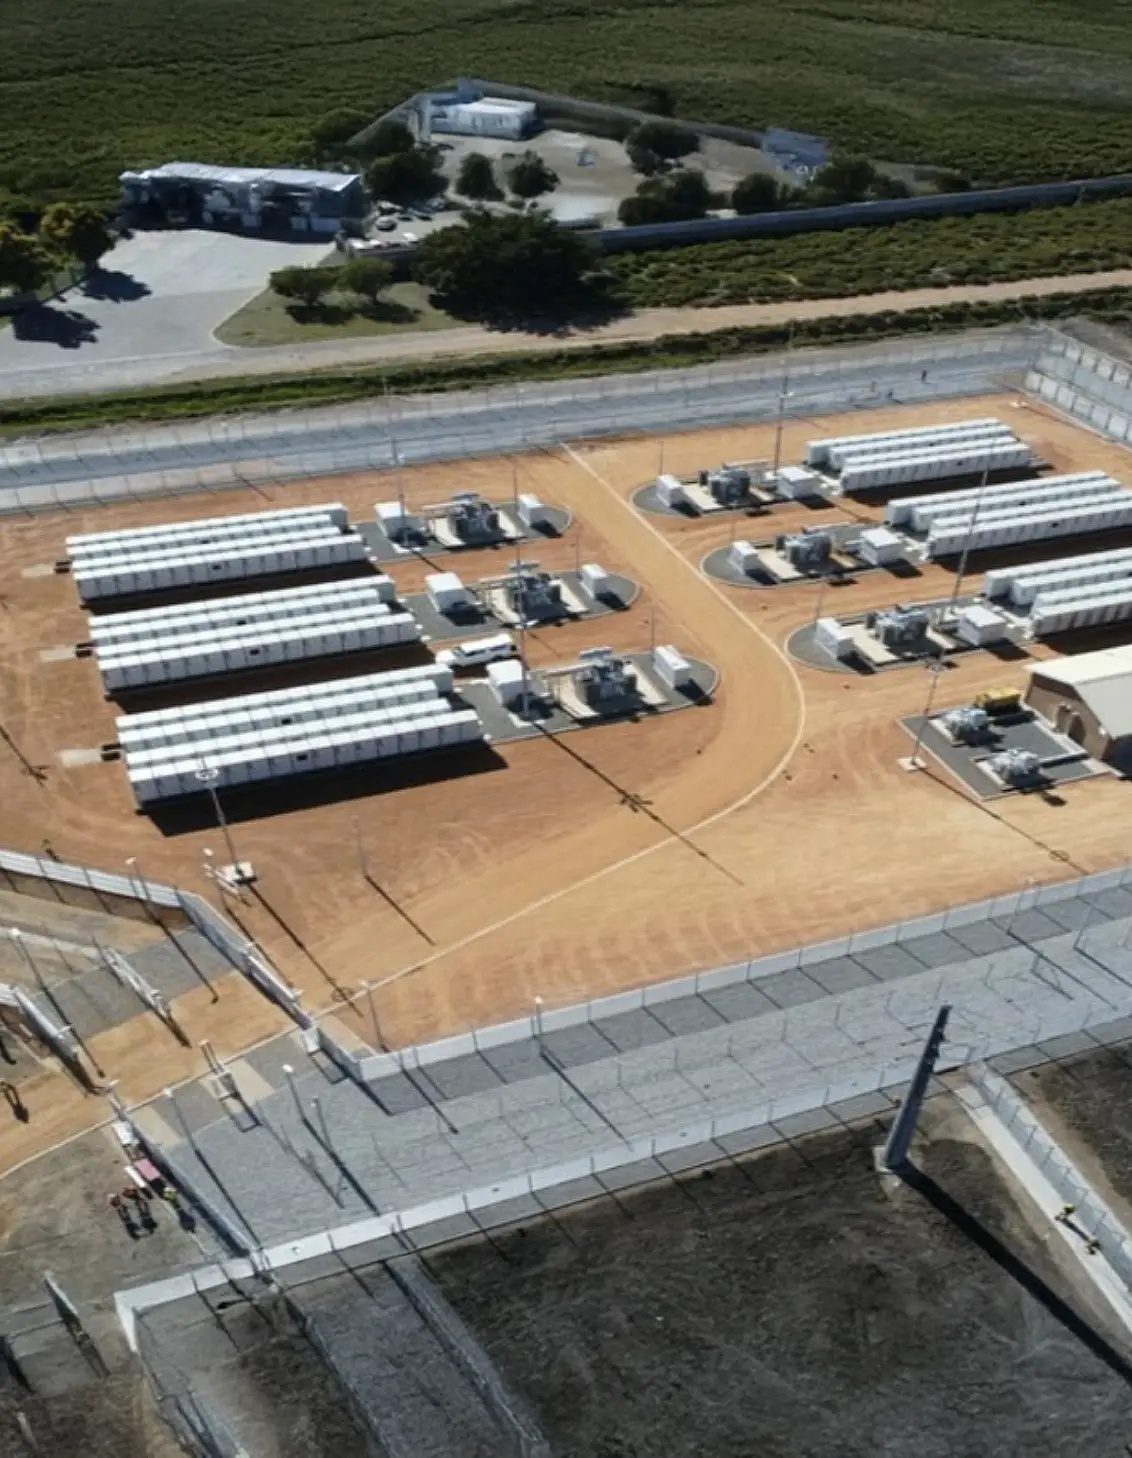
Storage and hybridisation strategy: screening 300+ sites for standalone BESS
Three ways to start small.
Scoped first engagements with a clear deliverable: the natural first step before a recurring mandate.
Revenue simulation of one asset
One storage, hybrid or renewable asset modelled in One Hub Analytics: base and stress scenarios, summary report structured for committee review.
Selected mandates.
No project photoBESS origination strategy for a 300 MW pipeline in Spain
No project photoStorage strategy for 25 MW and 100 MW BESS reference plants
 No project photo
Market agent benchmarking for the representation of a 90 MW PV portfolio

Mid-term revenue forecasting for balancing and ancillary services markets
No project photoTechnical asset management of Puerto Real III: 50 MWp PV with a co-located 44 MW / 90 MWh battery
No project photo